
Traffic Lighting
A visual technique that uses color to highlight performance against set targets or thresholds.
Overview
Traffic lighting uses colors, typically red, amber, and green, to show how values are performing against defined thresholds or targets.
By default, the traffic lighting statuses are linked to the following colors:
- Bad: If the value meets the rule, the visual item will be highlighted in red.
- Concerning: If the value meets the rule, the visual item will be highlighted in amber.
- Good: If the value meets the rule, the visual item will be highlighted in green.
- Neutral: If the value falls outside the range of the defined rules, the visual item will be highlighted in gray. This status cannot be manually assigned to a rule.
Add traffic lighting to your visuals to instantly highlight how your organization is performing against key targets, making it easier to spot areas that need attention and prioritize your review.
To add traffic lighting to your visual, click the Traffic light button ![]() on the Visual Actions menu. For more information, see Add Traffic Lighting Rules and Traffic Lighting Examples.
on the Visual Actions menu. For more information, see Add Traffic Lighting Rules and Traffic Lighting Examples.
Tip: Watch this video to learn how to add traffic lighting to your visual.
Supported visual types for traffic lighting
You can apply traffic lighting to highlight the metric values themselves or the difference values displayed in your visualization.
Traffic lighting can be added to the following visual types:
|
Visual Type |
Metric Traffic Lighting |
Difference Traffic Lighting |
|---|---|---|
|
Breakdown |
Yes |
Yes, metric, group, scenario, and time period comparisons |
|
Trend |
Yes, when there are no group bys |
Yes, metric, group, legend items, scenario, and year comparisons |
|
Trend Breakdown |
Yes, when there are no group bys |
Yes, metric, group, scenario, and year comparisons |
|
Table |
Yes |
Yes, calculated difference columns |
|
Movement Breakdown |
Yes |
|
Metric traffic lighting
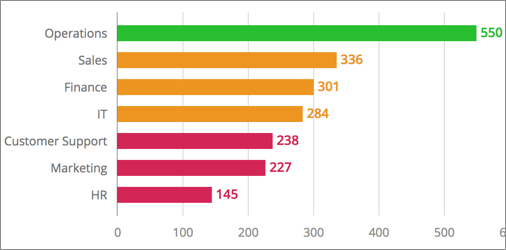
The following screenshot shows a visual with traffic lighting applied to the metric. To monitor the performance of the Headcount metric, the following traffic lighting rules were applied:
- Metric value is greater than 500, traffic light as Good.
- Metric value is greater than or equal to 250, traffic light as Concerning.
- Metric value is less than 250, traffic light as Bad.
Difference traffic lighting
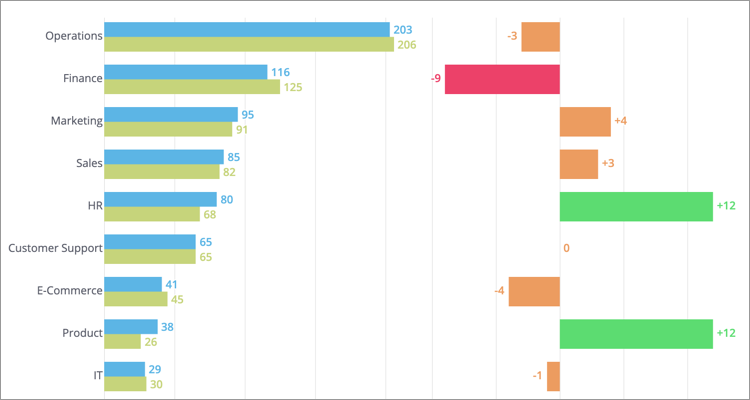
The following screenshot shows a visual with traffic lighting applied to the calculated difference. To monitor the change in Headcount compared to the previous year, the following traffic lighting rules were applied:
- Difference value is greater than +5, traffic light as Good.
- Difference value is between -5 and +5, traffic light as Concerning.
- Difference value is less than -5, traffic light as Bad.
In this section